Why a Gentle Learning Curve in BI Software Matters for Your Business
Signagelive, a digital signage platform serving customers in 43 countries, encountered a significant challenge: selecting a Business Intelligence tool that was accessible and effective for its international team. The journey of Founder & CEO Jason Cremins to find a tool offering the right mix of features and ease of use highlights the critical importance of a gentle learning curve in BI software for businesses globally.

Considering that only 37% of employees trust their decisions more when based on data, the case of Signagelive reinforces the vital importance of accessible Business Intelligence services for effective decision-making in businesses worldwide.
Understanding the Learning Curve in BI Software
The term 'learning curve' refers to the time and effort required to master new software. In the realm of BI, where complex data analysis is the norm, a steep learning curve can be a significant barrier. Business Intelligence software vendors are increasingly recognizing this, focusing on user-friendly designs that demystify data analysis.
The Impact of a Steep Learning Curve on BI Software Utilization
User Adoption and Engagement:
One of the most significant impacts of a steep learning curve in BI software is on user adoption and engagement. When Business Intelligence software vendors offer products with complex interfaces and functionalities, it can intimidate users, particularly those who are not tech-savvy. This intimidation often results in reluctance or outright resistance to using the software, leading to low adoption rates.
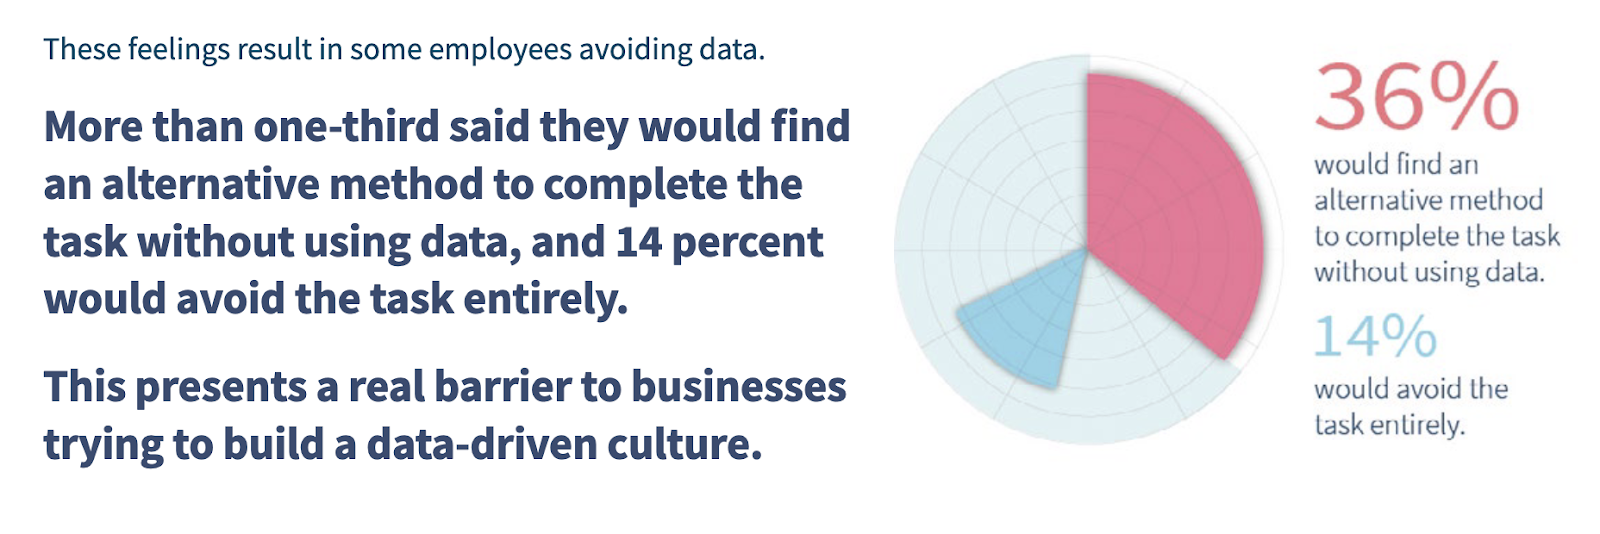
A significant 74% of employees report feeling overwhelmed or unhappy when working with data. When a Business Intelligence reporting suite is perceived as too complicated, users may resort to simpler, less effective tools, thereby diminishing the value of the sophisticated BI solutions.
Training and Resource Allocation:
Understanding why a gentle learning curve in BI software is essential can be underscored by the fact that only a quarter of new employees feel confident in using organizational data effectively, as reported by Accenture. It highlights a significant gap in data literacy and highlights the importance of user-friendly BI tools. Businesses, particularly SMEs, are often compelled to invest heavily in training programs for complex BI tools, an investment that can be burdensome.
Moreover, the time spent on training takes employees away from their core job functions, affecting overall productivity. A gentle learning curve in BI software not only eases this financial and time burden but also ensures that employees can quickly adapt to and efficiently use these tools, contributing to better data utilization and decision-making processes in the business.
Time to Value:
Another critical impact is the delay in achieving the 'time to value' — the time it takes for a business to see tangible benefits from its investment in BI software. Complex systems require longer periods for users to become proficient, delaying the point at which the software can start delivering actionable insights and contributing to decision-making processes.
Data Utilization and Quality of Insights:
A steep learning curve can also affect the quality and depth of data analysis. When users struggle with the functionalities of a Business Intelligence reporting suite, there's a tendency to underutilize its features. This underutilization leads to surface-level insights, as users may not delve into the more advanced analytics capabilities of the software. Consequently, businesses may miss out on critical insights that could drive strategic decisions.
The Hawkins Law Firm case study exemplifies how user-friendly BI tools like Grow can transform data utilization and insights. Initially struggling with complex data, the firm's adoption of Grow led to effective tracking of leads and case statuses, demonstrating the impact of accessible BI tools on deeper data analysis and strategic decision-making. This transition highlights the importance of simplicity in BI software to achieve comprehensive insights, beneficial across various organizational roles.
Innovation and Competitive Edge:
In today's fast-paced business environment, quickly adapting and innovating is crucial. Complex BI software can hinder this agility. Employees bogged down by intricate systems are less likely to experiment or explore innovative ways to use data. This situation can put businesses at a competitive disadvantage, especially when compared to those utilizing more user-friendly Business Intelligence services.
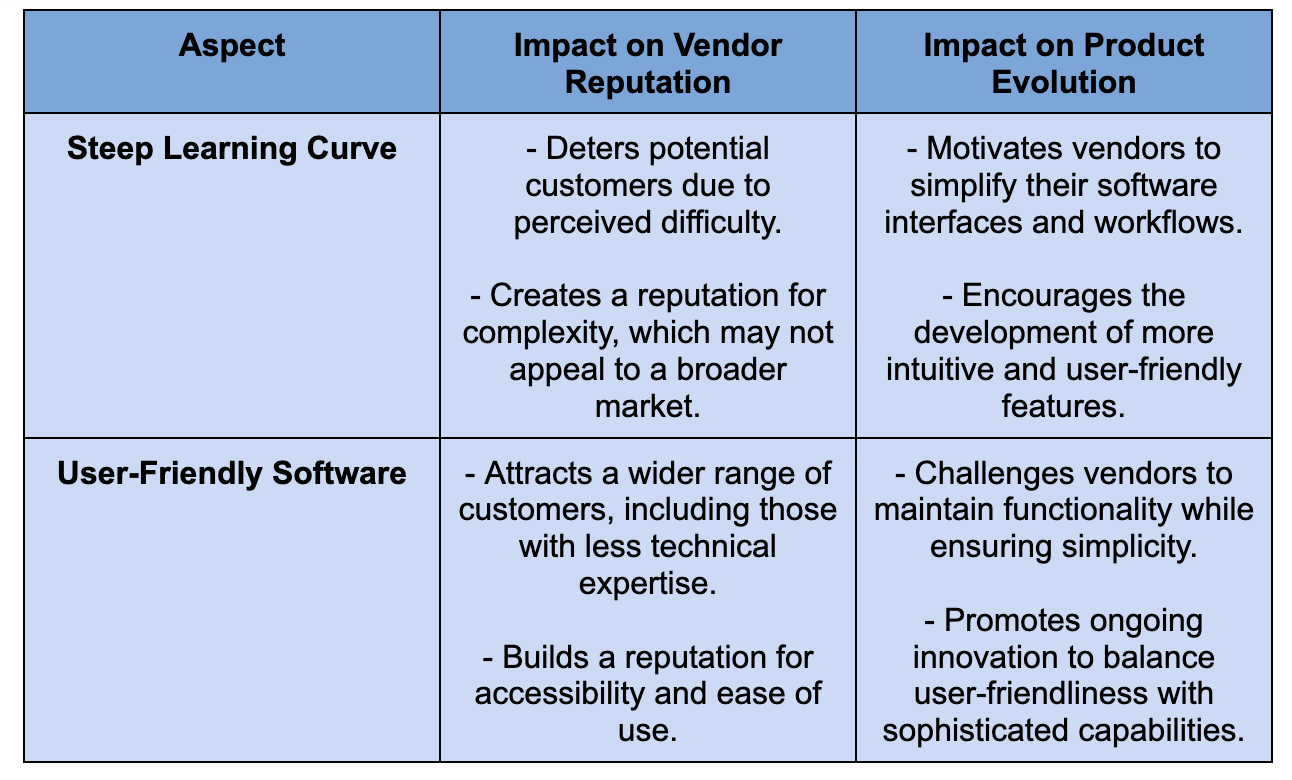
Vendor Reputation and Product Evolution:
The implications extend to Business Intelligence software vendors as well. A reputation for having software with a steep learning curve can deter potential customers. It also pushes vendors to continually evolve their products, seeking ways to simplify interfaces and workflows without compromising functionality.
Strategies to Flatten the Curve
To address these challenges, many Business Intelligence services and software vendors are adopting strategies to flatten the learning curve. This includes:
Intuitive Design: Simplifying the user interface to make it more intuitive and user-friendly.
Customization and Flexibility: Allowing customization of dashboards and reports to suit individual user needs.
Comprehensive Training and Support: Offering robust training programs and continuous support to assist users in navigating and mastering the software.
Community and Resources: Creating user communities and resource libraries to help users learn from each other and access helpful information.
Conclusion
The impact of a steep learning curve in BI software is multifaceted, affecting everything from user adoption to the strategic use of data within an organization. It highlights the need for Business Intelligence services and vendors to strike a balance between functionality and usability, ensuring that their tools are powerful yet accessible to a broad user base.
Addressing these challenges is key to maximizing the benefits of BI software in today's data-driven business landscape.
The journey of Signagelive, as well as 20,000 other businesses, towards embracing accessible BI tools like Grow demonstrates the profound impact of a gentle learning curve in BI software. Grow's features, highly rated for their customizable dashboards (8.5 score) and simplicity in uniting data from various sources, align with the need for intuitive data management.
Its capabilities in administration via a web and mobile interface, handling multiple data sources, and supporting various data formats such as MS Excel, Salesforce, and Google Analytics, cater to diverse business needs.
Additionally, features like drill-down analysis, report sharing, and pre-built visualization formats enhance collaborative and deep data analysis.
Grow’s BI dashboard tools exemplify how aligning software design with user needs can revolutionize data-driven decision-making. It addresses the challenges of overwhelming data complexity and underutilization due to steep learning curves, emphasizing the importance of making enterprise-quality data insights attainable for businesses of all sizes.
To witness how Grow’s Business Intelligence reporting suite can transform your business's approach to data and drive strategic decisions, explore further on "Grow.com Reviews & Ratings 2023 TrustRadius" and see how its features can streamline your BI experience.


Comments
Post a Comment