Why Customization Is the Key to Powerful Marketing Dashboards
Real Thread, an innovator in the apparel screen printing industry since 2009, faced significant challenges managing the logistics of acquiring materials, creating custom products, and shipping them to customers. Their previous business intelligence software couldn't handle real-time calculations or provide the necessary customization, limiting their ability to gain meaningful insights. The lack of visibility into core metrics and the inability to tailor dashboards to the specific needs of different teams hindered their operational efficiency and strategic decision-making.
Recognizing the critical need for customizable data visualization, Real Thread switched to Grow, experiencing an immediate transformation. With Grow, they could track essential metrics like on-time percentage, fully-fulfilled percentage, NPS scores, and order statuses in real time. This shift empowered each team to keep their most important numbers top-of-mind and act quickly on emerging insights.
Customization is not just a luxury in today’s data-driven world; it’s a necessity. Customization can lower acquisition costs by up to 50%, improve revenues by 5 to 15%, and enhance marketing spend efficiency by 10 to 30%. Imagine a dashboard that integrates seamlessly with your CRM, social media platforms, and web analytics, providing a comprehensive view of your marketing efforts. This is the power of a customized marketing dashboard. By focusing on the metrics that matter most to your business, you can make more informed decisions, optimize your marketing strategies, and ultimately drive growth.
Let’s dive in and discover how you can leverage customized marketing dashboards to take your business to the next level.
The Limitations of Generic Marketing Dashboards
Marketing dashboards are powerful tools, but generic versions often fall short. Standard dashboards may not align with a company’s unique goals, leading to:
- Irrelevant Metrics: Generic dashboards may display data that is not pertinent to a specific business’s objectives, cluttering the interface and making it harder to find valuable insights.
- Lack of Integration: Off-the-shelf solutions may not seamlessly integrate with all the necessary data sources, limiting the comprehensiveness of the insights.
- Inflexibility: Standard dashboards lack the flexibility to adapt to changing business needs and strategies.
The Power of Customization
Tailored Insights for Better Decision-Making
Customization enables businesses to design a marketing reporting dashboard that aligns with their unique goals and strategies. By focusing on the most relevant metrics and KPIs, customized dashboards provide deeper insights that drive more accurate and timely decisions.
For instance, a social media marketing agency may place a premium on engagement and follower growth as key performance indicators, whereas an online retailer may place a premium on conversion and average order value. This tailored approach ensures that every decision is backed by data that truly matters to the business.
Enhancing User Experience
One of the significant benefits of customization is the improved user experience it offers. Business Intelligence dashboard software allows for the creation of interactive and user-friendly dashboards that cater to different roles within an organization. Marketers, analysts, and executives have different information needs and prefer different ways of visualizing data. Customized dashboards can provide the necessary flexibility to present data in a manner that is most useful for each user, enhancing their ability to interpret and act on the information presented.
Data Integration and Comprehensive View
Effective marketing requires data from various sources, such as CRM systems, social media platforms, and web analytics tools. Customization allows businesses to integrate these diverse data sources into a single, cohesive dashboard Business Intelligence platform.
This comprehensive view eliminates data silos and provides a more accurate and holistic picture of marketing performance. Integrated dashboards streamline the analysis process, making it easier to identify correlations and trends across different channels.
Streamlining Workflows and Increasing Efficiency
Customized marketing dashboards can significantly streamline workflows by automating data collection and reporting processes. Instead of manually compiling data from multiple sources, marketers can rely on their customized dashboards to deliver real-time updates and insights. Not only does this automation save time, but it also decreases the likelihood of mistakes that come with manually managing data. As a result, marketing teams can focus more on strategy and execution rather than on data management.
Scalability and Adaptability
Companies' data requirements alter as they develop and expand. A customized marketing reporting dashboard offers the scalability to accommodate these changing requirements. Whether a company is expanding its marketing channels, launching new products, or entering new markets, its dashboards can be easily adjusted to reflect new priorities and metrics. This adaptability ensures that businesses always have access to relevant and up-to-date information, supporting continuous improvement and innovation.
Benefits of Customized Marketing Dashboards
1. Increased Efficiency
Custom dashboard Business Intelligence solutions streamline workflows by:
- Reducing Manual Tasks: Automated data collection and reporting free up time for strategic analysis and decision-making.
- Quick Access to Insights: With tailored dashboards, relevant information is readily available, enhancing the speed and quality of decisions.
2. Improved Collaboration
Customization fosters collaboration by:
- Shared Dashboards: Providing different teams with access to the same customized data, ensuring everyone is aligned and informed.
- Role-Based Access: Tailoring data access based on user roles, so each team member sees the most relevant information for their tasks.
3. Scalability and Flexibility
Customizable Business Intelligence dashboard software is inherently scalable:
- Adapting to Growth: As businesses grow and evolve, their data needs change. Custom dashboards can scale to accommodate new data sources and metrics.
- Continuous Improvement: Businesses can continuously refine and adjust their dashboards to keep up with changing strategies and market conditions.
Key Customization Features in Marketing Dashboards
When it comes to marketing, data is important. However, raw data alone isn't enough. The ability to customize marketing dashboards is what transforms data into actionable insights. Let’s dive into the key customization features that make marketing dashboards truly powerful.
Data Integration
One of the foundational aspects of customized marketing dashboards is seamless data integration. Businesses operate across multiple platforms, from CRM systems to social media channels and web analytics tools. Integrating these diverse data sources into a unified Business Intelligence dashboard software provides a holistic view of marketing performance. This integration not only eliminates data silos but also ensures that all relevant data is available in one place. For instance, combining customer relationship data with social media engagement metrics can reveal insights into how different customer segments interact with marketing campaigns, allowing for more targeted strategies.
To achieve this, the data integration process often involves using APIs (Application Programming Interfaces) to pull data from various platforms into the BI software. ETL (Extract, Transform, Load) processes are also employed to standardize data formats and ensure that data from different sources can be compared and analyzed cohesively. The use of data warehouses and data lakes further supports the aggregation of large datasets, enabling comprehensive and detailed analysis.
Interactive Elements
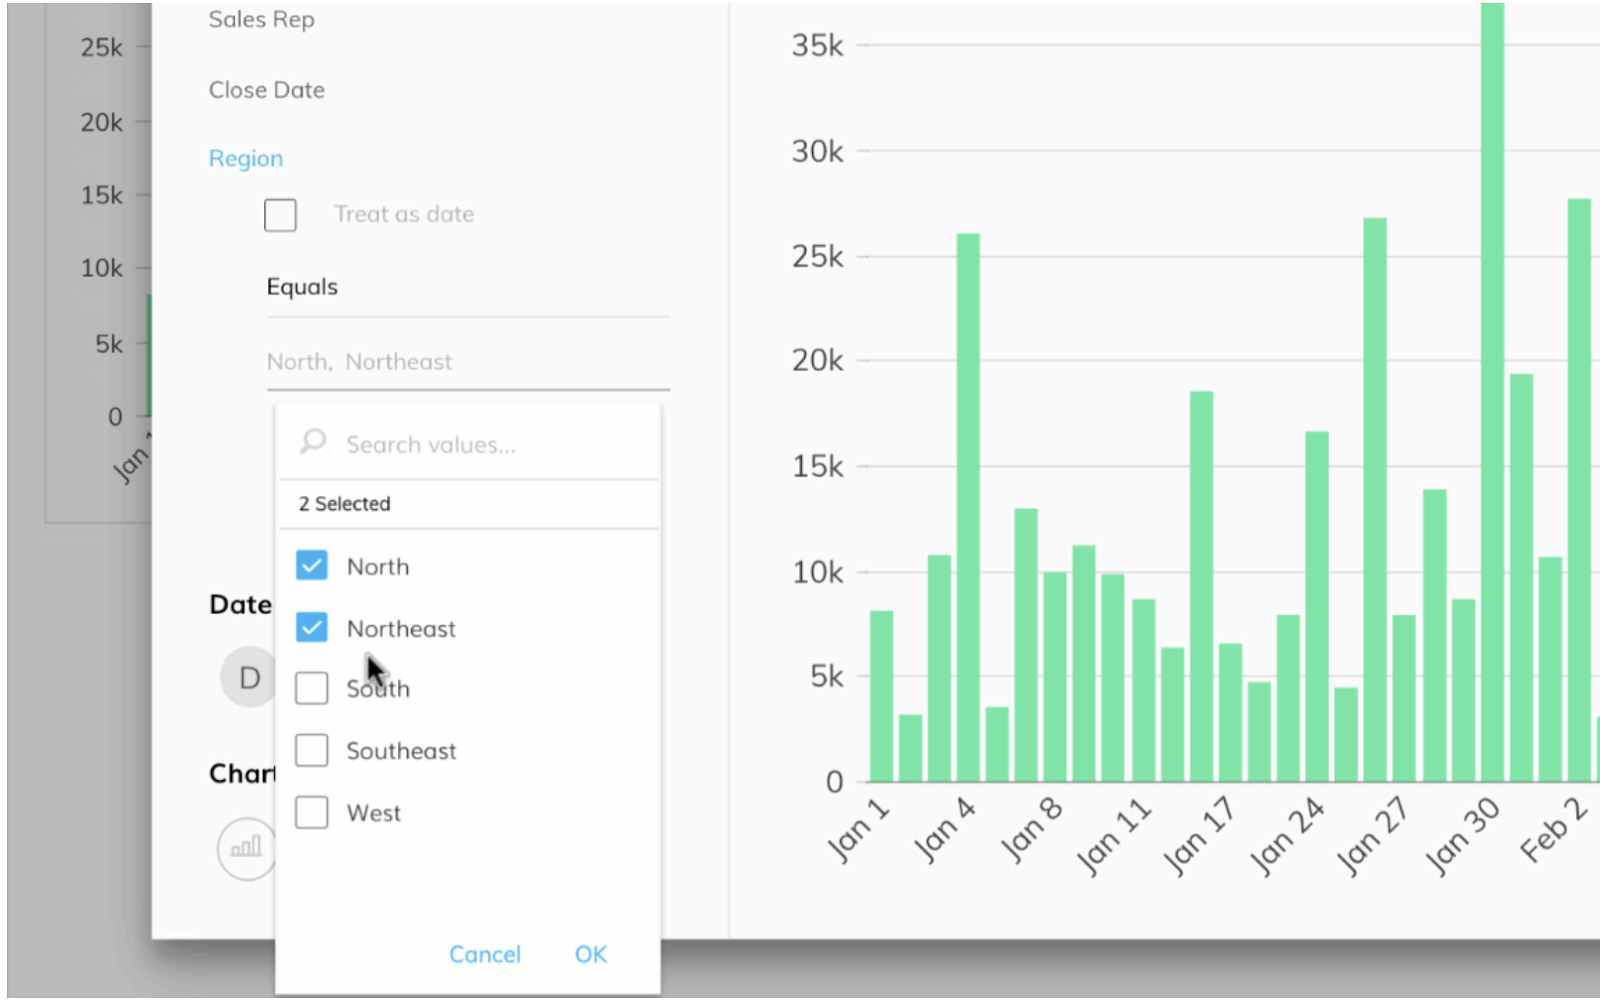
If marketing reporting dashboards want to be more effective and user-friendly, they must have interactive features. Users can engage with the data in meaningful ways with features like filters, drill-down capabilities, and dynamic visualizations. Instead of static reports, interactive dashboards enable users to explore data from various angles and uncover deeper insights.
For example, a marketing manager might use drill-down features to analyze campaign performance by region, product line, or customer demographic. These interactive elements make the data more accessible and actionable, leading to more informed decision-making.
Technical implementation of these interactive features often involves using JavaScript libraries like D3.js or frameworks like React for building dynamic user interfaces. These tools allow for the creation of responsive and intuitive dashboards where users can click, drag, and filter data in real-time. Additionally, back-end technologies like Node.js can handle real-time data processing and ensure that the interactive elements are responsive and up-to-date.
Personalized Metrics and KPIs
Twenty dollars for every dollar invested is the return on investment for companies that apply advanced customization.
Customization allows businesses to focus on the metrics and Key Performance Indicators (KPIs) that matter most to them. Generic dashboards often include a broad range of metrics, many of which may not be relevant to specific business goals. By tailoring dashboard Business Intelligence tools to highlight personalized metrics, businesses can ensure that their dashboards provide the most pertinent information.
For instance, a company focused on improving customer acquisition might prioritize metrics such as cost per acquisition and conversion rates, while a brand aiming to enhance customer loyalty would focus on retention rates and customer lifetime value. This level of customization ensures that the dashboard delivers insights aligned with strategic objectives.
In practice, setting up personalized metrics involves configuring the BI software to calculate and display specific KPIs. This may require custom SQL queries, the creation of calculated fields, or the development of custom scripts to derive metrics from raw data.
Advanced BI tools also support machine learning algorithms that can predict future performance based on historical data, providing even more personalized and forward-looking insights.
Learn more at Perfecting Your BI Experience with Personalization
Automated Reporting
This is another critical feature of customized marketing dashboards. With automated reporting, businesses can schedule regular updates and alerts based on specific criteria. This feature reduces the time and effort required to generate reports manually, allowing marketing teams to focus on strategic tasks.
For example, an automated report might be set up to alert the marketing team when website traffic drops below a certain threshold or when a social media campaign achieves a predefined engagement level. These automated alerts ensure that teams are promptly informed of significant changes, enabling quick responses to emerging trends or issues.
Implementing automated reporting typically involves setting up workflows within the BI software. These workflows can be triggered by events (such as a new data update) or set to run at specific intervals (daily, weekly, monthly).
Using scripting languages like Python, users can create scripts that pull data, process it, and generate reports automatically. Advanced scheduling tools and integrations with email or messaging platforms ensure that reports and alerts reach the right stakeholders without delay.
Real-Time Data and Predictive Analytics
The ability to access real-time data is a game-changer for businesses looking to stay ahead of the competition. Customized marketing reporting dashboards can provide real-time updates, allowing businesses to monitor and optimize campaign performance as it happens. This immediacy enables quick adjustments to strategies, optimizing outcomes.
Additionally, incorporating predictive analytics into these dashboards can offer forward-looking insights. By analyzing historical data and identifying patterns, predictive analytics can forecast future trends and performance.
For example, a business might use predictive analytics to anticipate seasonal fluctuations in demand or to identify emerging market segments.
Real-time data integration requires robust architecture capable of handling continuous data streams. Technologies like Apache Kafka or Amazon Kinesis can process real-time data feeds, while BI tools such as Grow or Power BI can visualize this data instantly.
Predictive analytics, on the other hand, leverages machine learning models and statistical algorithms to analyze historical data and make forecasts. Tools like TensorFlow, Scikit-learn, and R are commonly used to develop these predictive models, which are then integrated into the BI dashboard for real-time insights.
Enhanced Visualization Techniques
Improving the ability to understand and act upon complicated data requires effective data visualization. Customized marketing dashboards often employ advanced visualization techniques, such as heat maps, scatter plots, and geospatial maps, to represent data visually. These techniques help users quickly grasp patterns and relationships within the data.
For instance, a heat map might be used to highlight regions with the highest customer engagement, while a scatter plot could illustrate the correlation between marketing spend and sales growth. Enhanced visualization not only makes the data more digestible but also aids in identifying actionable insights more efficiently.
To achieve these advanced visualizations, BI tools provide extensive libraries and customization options. Visualization libraries like Highcharts, Chart.js, and Plotly offer a range of chart types and customization options. Geospatial data visualization often involves using tools like Mapbox or Google Maps APIs to create interactive maps that display geographic data in a meaningful way. These visualizations are integrated into the dashboard, providing users with powerful tools to analyze and interpret their data visually.
Conclusion
Customization is not just an added benefit but a crucial element that transforms marketing dashboards into powerful tools for business intelligence. By tailoring dashboards to meet specific business needs, you can gain deeper insights, enhance user experience, streamline workflows, and ensure scalability. With these customized capabilities, companies can enhance their marketing campaigns and drive growth with data-driven decisions.
Grow’s Business Intelligence dashboard software excels in providing these customization capabilities, allowing you to integrate data seamlessly, interact with your metrics dynamically, and set up personalized KPIs and automated reports. With Grow, you can unlock the full potential of your marketing data and stay ahead in the competitive market.
Do you want to know what a difference customized marketing reporting dashboards can make? Start your 14-day free demo with Grow and see how our platform can transform your marketing strategies.
Learn more about Grow's capabilities and read user reviews on Capterra: Grow Cost & Reviews Capterra.
Take the next step towards data-driven success with Grow!


Comments
Post a Comment