Why Transparency in Dashboard Business Intelligence Can Make or Break Your Strategy
Have you ever found yourself making a business decision based on incomplete or unclear data? How often do you question the accuracy and reliability of the information displayed on your BI dashboards? You would not be the only one if you experienced any of these things.
According to a recent survey, the average firm believes that 27% of their data is incorrect, and the executive suite thinks that number is far higher. leads to bad business decisions, costing them an average of $15 million per year.
Transparency in dashboard Business Intelligence (BI) is not just a nice-to-have—it's a critical component that can make or break your strategy.
Having transparent, clear, and accurate data is undeniable for making informed decisions. Transparent BI dashboards ensure that every piece of data is presented in a way that is easily understood and trusted by all stakeholders. Without this transparency, businesses risk making costly errors, misaligning their teams, and failing to execute their strategic plans effectively.
Consider Launch Leads, a firm that finds potential customers and sets up appointments with them. CEO Scott Smith recognized that real-time insights and improved internal visibility were essential for better performance. Before using Grow, gaining these insights was challenging. Now, with Grow BI, every level of the company—from the CEO to sales reps—benefits from transparent and accessible data, enhancing performance and maintaining strategic focus.
“Grow provides transparency at every level, drives performance, and creates healthy competition,”
-says Smith.
This blog will delve into why transparency in BI dashboards is crucial for your business strategy, how it can enhance decision-making, build trust, and improve strategic alignment. We'll also explore real-world examples and best practices to help you implement transparent BI dashboards that drive success.
Understanding Transparency in BI Dashboards
Transparency in Business Intelligence dashboards is more than just a buzzword—it's a fundamental aspect that can significantly impact the effectiveness of your business strategy.
What is Transparency in BI Dashboards?
Transparency in dashboard Business Intelligence refers to the clarity, accessibility, and accuracy is what we mean when we talk about business intelligence. It ensures that all stakeholders can easily understand and trust the information displayed, leading to informed decision-making and strategic alignment. Here’s a deeper dive into the key components of transparency:
- Clarity
- Clear Visualization: Dashboards should present data in a visually clear and intuitive manner. This includes using appropriate chart types, avoiding clutter, and ensuring that metrics are easily interpretable.
- User-Friendly Interface: The interface should be designed with the end-user in mind, allowing easy navigation and interaction with the data.
- Accessibility
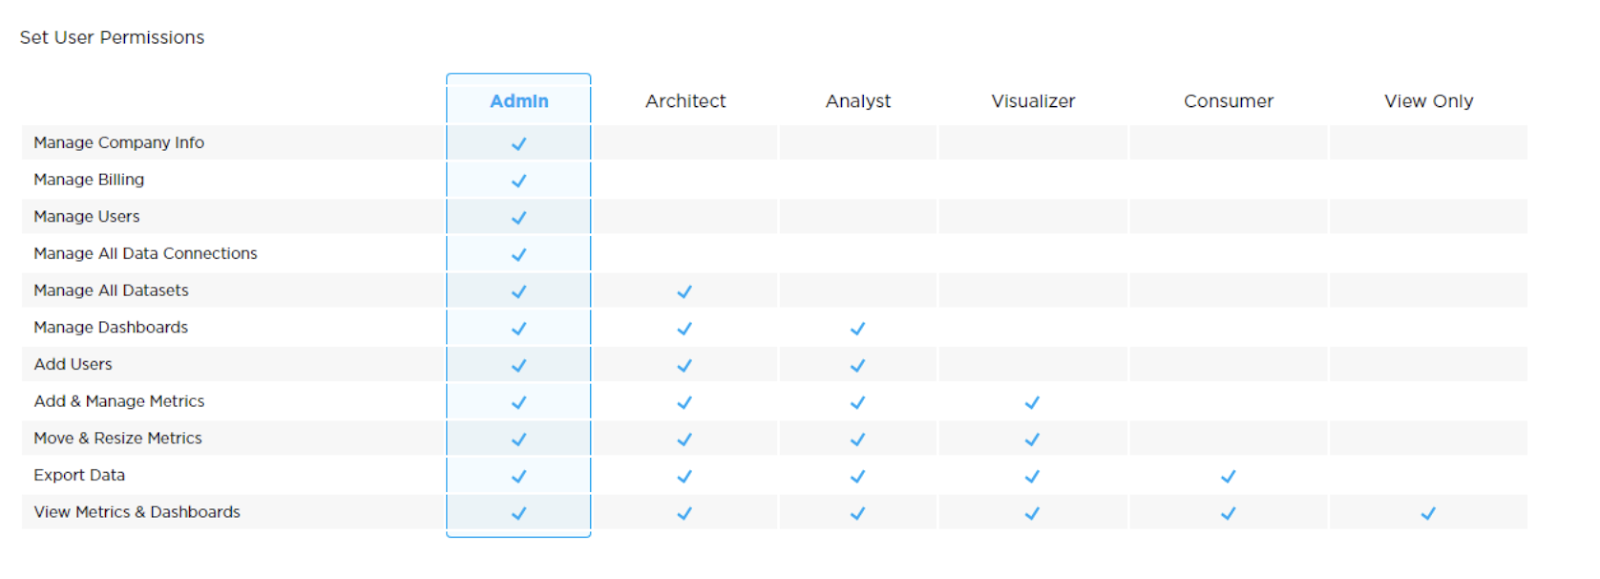
- User Access Levels: Different stakeholders require different levels of access to data. Ensuring that everyone has the appropriate access without compromising data security is essential.
- Device Compatibility: The best Business Intelligence dashboards are accessible across various devices, ensuring that users can access critical data anytime, anywhere.
- Accuracy
- Data Integrity: Ensuring that the data feeding the dashboard is accurate and up-to-date is critical. This involves regular data validation and quality checks.
- Source Transparency: Users should be able to trace the data back to its source, which builds trust and enables deeper analysis.
How Transparency in BI Dashboards Enhances Decision-Making
- Clear Data Visualization
Transparent BI dashboards provide clear and intuitive data visualizations that help users quickly grasp complex information. This clarity is essential for effective decision-making. When data is presented in an easily understandable format, it reduces the cognitive load on users, allowing them to focus on strategic insights rather than deciphering complicated charts.
For instance, the best Business Intelligence dashboards use simple and effective visual elements such as bar charts, line graphs, and pie charts to represent data. This approach ensures that critical metrics are highlighted and easily interpreted.
- Accurate and Up-to-Date Information
Transparency in a Business Intelligence dashboard means that the data displayed is accurate and up-to-date. Decision-makers rely on real-time information to make timely choices that can impact the direction of their business. Regular updates and data validation processes are crucial to maintaining this accuracy.
Grow business intelligence, for example, offers features that ensure data accuracy and timeliness. By conducting a Grow demo, businesses can see how real-time data updates and transparent data sources can enhance their decision-making processes.
- Accessibility to All Stakeholders
Transparent BI dashboards are designed to be accessible to all relevant stakeholders within an organization. This accessibility ensures that everyone, from executives to team leads, has the information they need to make informed decisions. User-friendly interfaces and customizable views are key components of this accessibility.
Using advanced Business Intelligence dashboard tools, organizations can provide tailored access to different users based on their roles and needs. This level of customization supports more precise and effective decision-making.
2 Brothers Moving & Delivery, a data-centric company in Portland, Oregon, uses Grow to make their data universally accessible and engaging for all team members. Previously, employees struggled with complex spreadsheets, but Grow’s user-friendly dashboards now display critical performance metrics visibly in the office, fostering transparency and understanding. This accessibility has led to increased goal orientation and operational efficiency, crucial for their strategic vision of a “touchless move” service.
- Building Trust and Accountability
Transparency builds trust among stakeholders. When everyone has access to the same clear and accurate data, it fosters a culture of trust and accountability. Stakeholders can be confident that the decisions being made are based on reliable information.
For example, business dashboard software that includes features like data lineage and audit trails allows users to trace data back to its source. This transparency not only builds trust but also ensures that any discrepancies can be quickly identified and addressed.
- Enhancing Strategic Planning
Transparent BI dashboards play a critical role in strategic planning. By providing a comprehensive view of the business's performance, these dashboards enable decision-makers to identify trends, spot opportunities, and mitigate risks. This strategic insight is invaluable for long-term planning and growth.
Grow BI is particularly effective in enhancing strategic planning through its comprehensive data integration with over 100 native integrations and visualization capabilities. Businesses can leverage Grow data to gain deeper insights and make more informed strategic decisions.
- Improved Execution and Monitoring
Once a strategy is in place, transparent dashboards facilitate better execution and monitoring. Business Intelligence dashboard tools like Grow BI allow for continuous tracking of strategic initiatives, ensuring that all stakeholders are aligned and informed. For instance, a transparent dashboard can track key project milestones and performance metrics, providing real-time feedback on progress and highlighting areas that need attention.
A mid-sized retail company faced significant financial losses because its BI dashboards were not transparent. The dashboards lacked real-time updates and provided incomplete data, leading to misinformed decisions about inventory management. This resulted in overstocking unpopular items and understocking best-sellers, causing both financial strain and customer dissatisfaction.
- Alignment Across the Organization
Transparent dashboards promote alignment across different departments and teams. When everyone in the organization has access to the same clear and accurate data, it fosters a unified approach to strategy execution. Business dashboard software that supports transparency ensures that all team members are working towards common goals, reducing silos and enhancing collaboration.
- Proactive Risk Management
Transparent dashboards enable proactive risk management by highlighting potential issues before they become critical. For example, Grow data analytics can reveal early warning signs of financial anomalies or operational inefficiencies, allowing businesses to address these risks promptly. This proactive approach helps in safeguarding the organization's strategic objectives and maintaining steady progress towards goals.
Conclusion
Transparency in dashboard Business Intelligence is a critical factor that can significantly influence the success or failure of your business strategy. Clear, accurate, and accessible data empowers decision-makers, builds trust among stakeholders, and ensures organizational alignment. Without transparency, businesses risk making poor decisions, facing operational inefficiencies, and ultimately failing to execute their strategic plans effectively.
Embracing transparent BI practices involves choosing the best Business Intelligence dashboards and business dashboard software that prioritize clarity and accuracy. Tools like Grow BI are designed to enhance transparency with features such as real-time data updates and intuitive visualizations. By integrating Grow data into your BI strategy, you can ensure that your dashboard Business Intelligence provide the insights needed for informed decision-making and strategic success.
Ready to transform your BI strategy? Try Grow BI with a 14-day free demo and experience firsthand how transparent data can drive your business forward. For more insights and user reviews, visit the Grow data dashboard Trustradius and see how Grow BI can make a difference in your organization.
Take the next step towards effective decision-making and strategic excellence with transparent BI dashboards from Grow.


Comments
Post a Comment